
[Project Notes] Push Any Letter: 52 Shapes, Planner Demonstrations, and Eight Imitation Policies
Published:
With ten demonstrations per letter and target orientation, our state-based ACT policy solved 319 of 520 unseen-angle tasks (61.35%). The image comparison was much closer: ACT solved 227 and Flow Matching solved 226. That one-episode difference is too small to support a reliable ranking from one training seed.
I built Push Any Letter to extend planar pushing beyond a single T and make the geometry of contact part of the experiment. This report records the completed V1 comparison: 52 letters, 6,240 successful planner demonstrations, and four algorithms trained with each of two observation types. My starting recommendation for this state benchmark is ACT. For images, I would keep both ACT and Flow in the next comparison.
Lixin Xu (许立昕) · Interactive project and replays · Code and planning method · Dataset
The final result, with the evaluation unit attached
All eight policies use the final EMA checkpoint at 100,000 optimizer updates. Each receives the same 520 tasks: ten target orientations absent from the demonstration grid, shared across 52 letters, with a fresh start for every letter–orientation pair. A rollout has at most 2,400 control steps and succeeds when geometric coverage reaches 95%. Coverage in the table is the mean at the end of each rollout, including failures.
| Algorithm | State successes / 520 | State coverage | Image successes / 520 | Image coverage |
|---|---|---|---|---|
| BC | 0/520 (0.00%) | 18.28% | 5/520 (0.96%) | 35.79% |
| Diffusion Policy | 33/520 (6.35%) | 47.00% | 191/520 (36.73%) | 69.12% |
| Flow Matching | 25/520 (4.81%) | 47.55% | 226/520 (43.46%) | 72.05% |
| ACT | 319/520 (61.35%) | 83.33% | 227/520 (43.65%) | 79.93% |
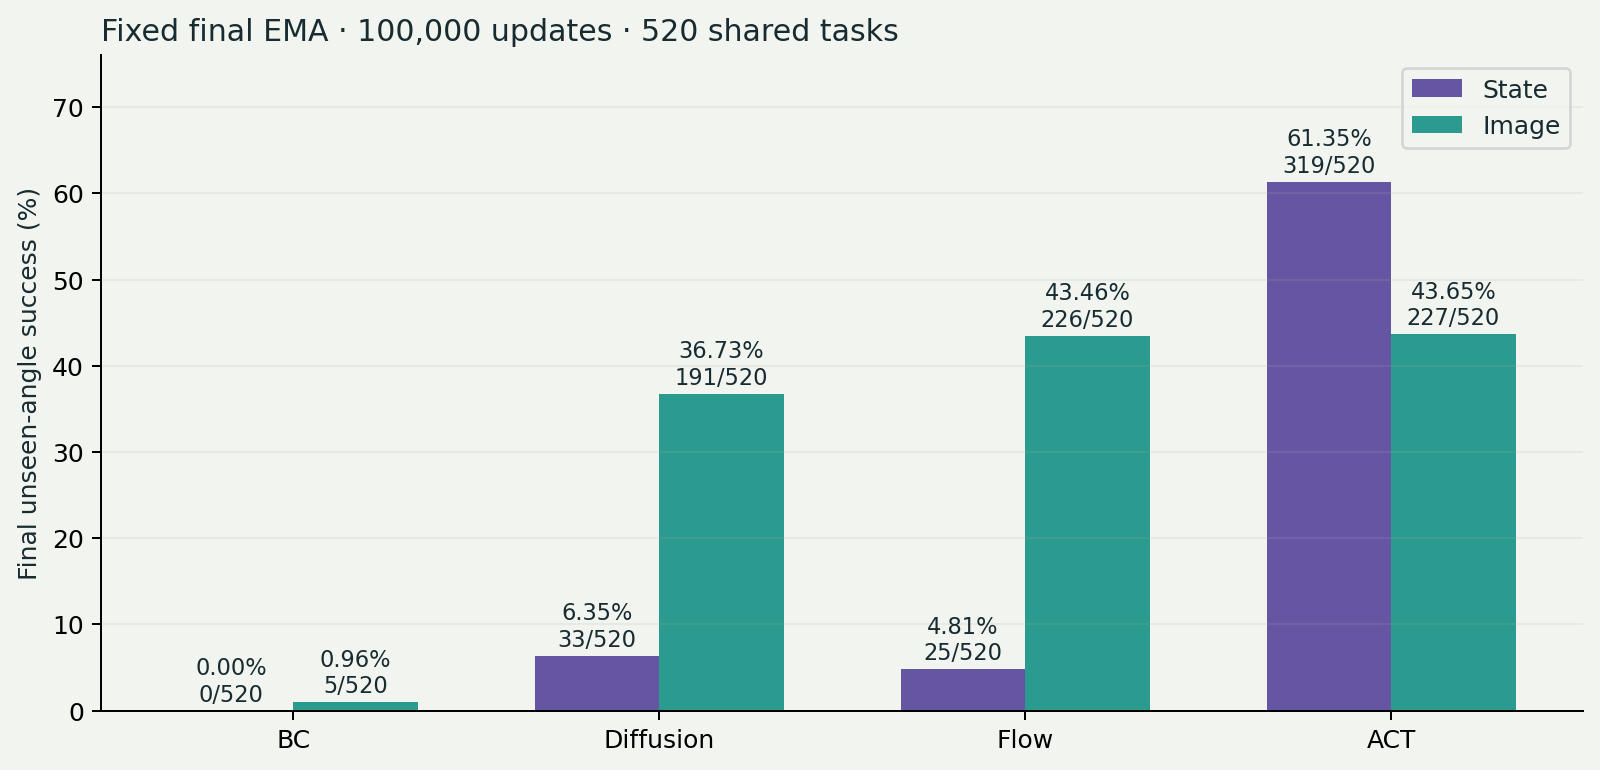
The stronger image results for Diffusion and Flow do not establish that pixels are generally preferable to object state. The visual encoder changes the representation and parameter count; the pose-only state input describes the shape through a letter identity rather than an explicit outline. We did not isolate those effects. ACT’s higher mean image coverage also deserves attention: it reaches 79.93%, versus Flow’s 72.05%, despite their nearly equal thresholded success rates.
These are results of our compact implementations and one seed, not a reproduction of the original papers’ benchmark rankings. Download exact counts and configurations or the final-results CSV.
A letter is a rigid body with a particular outline
The environment uses Pymunk for physics and Pygame for display. Font outlines become polygonal geometry, then triangles attached to one rigid body. Holes remain empty. Disconnected pieces, such as the dot on a lowercase i, move with the rest of the letter. A circular pusher follows a force-limited position servo in a 640 × 640 arena. The simulator runs on CPU and supports macOS.
The V1 distribution contains A–Z and a–z in Arial Bold, with every target centered at (320, 320). Target orientations are 0°, 30°, …, 330°. Starts vary in position and angle; the complete rotated glyph starts at least 48 pixels inside the inner wall. Initially solved states are rejected. The pusher starts clear of the object.
The benchmark uses object contact friction 1.4, pusher friction 0.6, and Pymunk space damping 0.12. The generic environment constructor defaults to object friction 0.7, so reproduction must set 1.4 explicitly. Damping and contact friction are different parameters. Control runs at 20 Hz with ten physics substeps per action, or 200 Hz physics. This report contains no controlled friction ablation.
Coverage is intersection area divided by goal area. This definition accepts geometric symmetries: an orientation label can differ while the visible shape is aligned. It also gives the same success meaning to wide, narrow, concave and hollow glyphs.
Where the 6,240 demonstrations came from
The demonstrations were generated by our contact-sampling model-predictive controller. It has privileged access to object state, collision geometry and a simulator. At each planning iteration it samples approach/contact candidates, simulates different push directions and lengths in copied environments, and keeps a useful action prefix. The cost combines squared translation error with a rotation term scaled by the body’s moment-to-mass ratio; detected rotational symmetries are considered. An approach-length penalty discourages unnecessarily long detours. The real episode advances only through the selected pusher actions.
The released generation run used 20 contact samples, at most 40 planning iterations and 2,400 control steps per attempt, with generation seed 20261026 and 128 CPU workers. Different initial states and planner seeds provide multiple solutions per condition. It accepted 6,240 of 6,269 attempts, filling 52 × 12 × 10 slots. That acceptance fraction describes this data-generation procedure, including retries; it is not a held-out learned-policy score or evidence that paths are optimal.
Every accepted episode was replayed independently from its reset state, using only the saved actions. The validator checks finite arrays, action bounds, matching rewards and termination flags, no steps after termination, arena bounds, state error below 0.001 and pusher penetration below 3 pixels. Replay must finish successfully. Recorded maximum state error across the release was zero under the matching setup. Replay consistency certifies agreement with this simulator, not physical realism outside it.
V1 contains 4,736,343 transitions, with 23–2,385 steps per episode and a mean of 759.0. Its 52 TAR shards occupy about 3.19 GB; each episode is an internally compressed NPZ. All 52 published shard hashes and sizes were rechecked against the V1 release source for this report.
The public dataset’s default branch can advance. These results use center12-friction14-v1, pinned to Hugging Face revision 8c02168906f991bc07ee3648bee6290babf13e47. The matching font hash is d72db21f9242aedd6b917d8549ad5921766b24d5f8d0becfda2ff4c620b3c2e0. Font binaries are excluded from the release; changing the font changes the task geometry.
What the policies observe and predict
Stored state observations have eight values: pusher XY, object XY, object angle, goal XY and goal angle. Stored actions are absolute pusher XY targets, clipped to [28, 612]². RGB observations are 96 × 96 × 3 uint8 frames captured before the corresponding action. The records also contain next states, rewards, termination flags and metadata.
For state training, each frame becomes 62 features: six normalized position coordinates, sine and cosine of object and goal angles, and a 52-way letter one-hot vector. Every policy receives a two-frame history. Velocities and planner internals are not inputs to these imitation policies.
For image training, each frame contains RGB plus 58 auxiliary values: pusher XY, goal XY, sine/cosine of the goal angle, and the letter one-hot vector. Current object pose and velocity are excluded. A trainable residual CNN with GroupNorm, 32 spatial-softmax keypoints and a 256-dimensional embedding encodes each frame. This is image plus proprioception and task information. The goal outline is visible in the image. Each algorithm has its own independently trained encoder.
History repeats the initial frame at reset. Sample windows never cross episode boundaries, and padded end-of-episode actions are masked from the loss. All ten demonstrations per condition are used for training; there is no held-out demonstration split. Online evaluation supplies new starts instead.
Four objectives under a fixed update budget
| Algorithm | Implementation in this project | Predict / execute |
|---|---|---|
| Vanilla BC | Three 256-wide MLP layers, action MSE | 1 / 1 |
| Diffusion Policy | Conditional 1D U-Net with FiLM; noise prediction over 100 cosine diffusion steps; 10-step DDIM sampling | 16 / 4 |
| Flow Matching | Same U-Net; independent Gaussian-to-action linear paths; velocity regression; 10 Euler integration steps | 16 / 4 |
| ACT | Transformer CVAE, latent 32, width 128, two encoder/decoder layers; L1 + 10 × KL; zero latent at inference | 16 / 4 |
The method sources are Diffusion Policy, Chi et al., Flow Matching, Lipman et al., and ACT / ALOHA, Zhao et al.. Push-T also motivates the environment. Our implementation keeps the stated objectives but changes architecture size, observations and task. ACT executes four actions before replanning and does not use temporal aggregation. Flow uses independently paired noise and data, without an optimal-transport coupling. BC has a shorter horizon than the other methods, which limits causal interpretations of the comparison.
Every run uses seed 42, 100,000 updates, effective batch size 256, AdamW with learning rate 1e−4, warmup and cosine decay, weight decay 1e−4, gradient clipping at 1, and EMA decay 0.995. Image training accumulates four microbatches of 64. Episodes and within-episode times are sampled uniformly, so longer episodes do not automatically dominate. Runs used four shared RTX 5090 GPUs with PyTorch 2.8.0 and CUDA 12.8. Equal updates do not imply equal compute.
Parameter counts range from 0.164M to 1.793M for state policies and 3.114M to 4.743M for image policies. The public source reference is revision 73289a1. We compared deployed source hashes with that revision: the core model, training, evaluation and environment files match; public data-loading, font-resolution and launch adapters include portability changes. The downloadable results record preserves the exact training-source hashes and names the differences, rather than claiming a historical training Git revision that was not recorded.
Loss falls much more easily than rollout failure disappears
Loss was logged every 100 updates. Faint lines below are raw observations; bold lines are trailing means over 20 logged points. Each algorithm has its own logarithmic axis because action MSE, noise MSE, velocity MSE and L1-plus-KL are different objectives. Comparing their vertical values would be misleading.
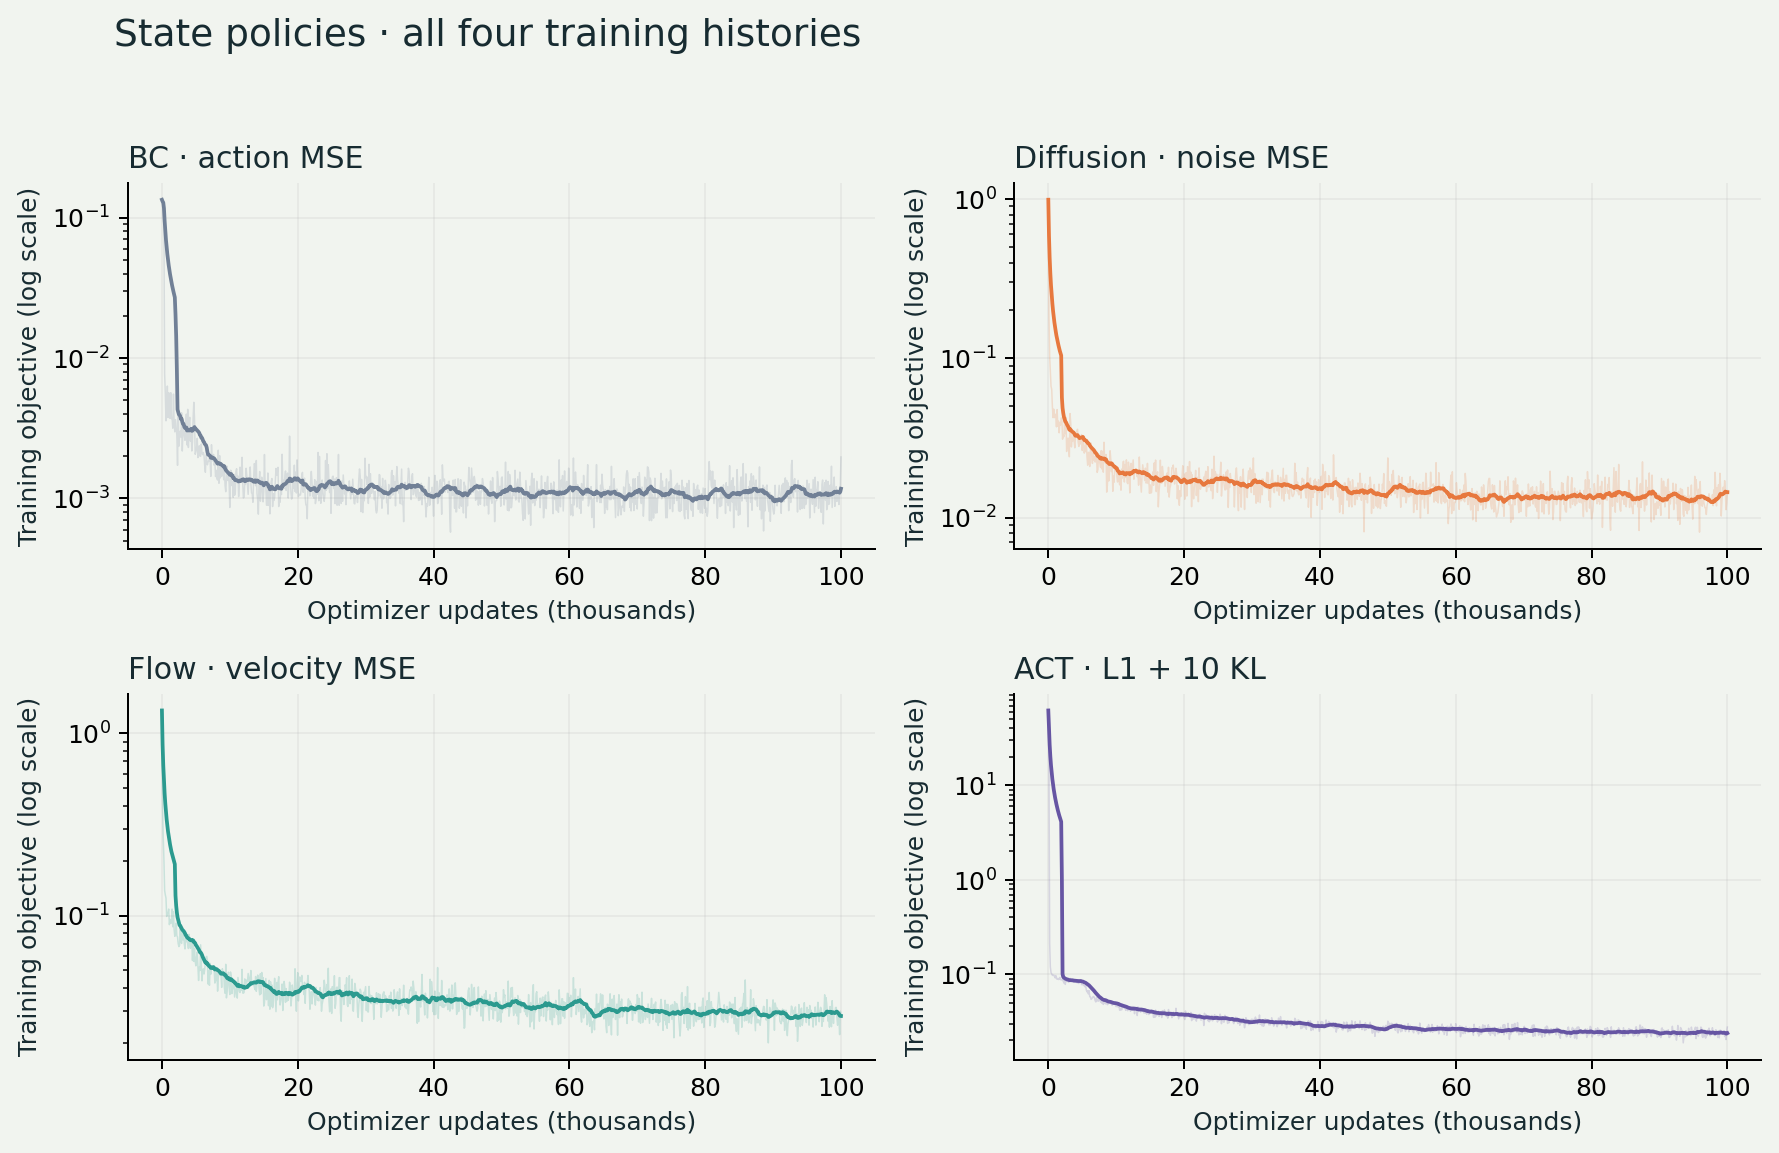
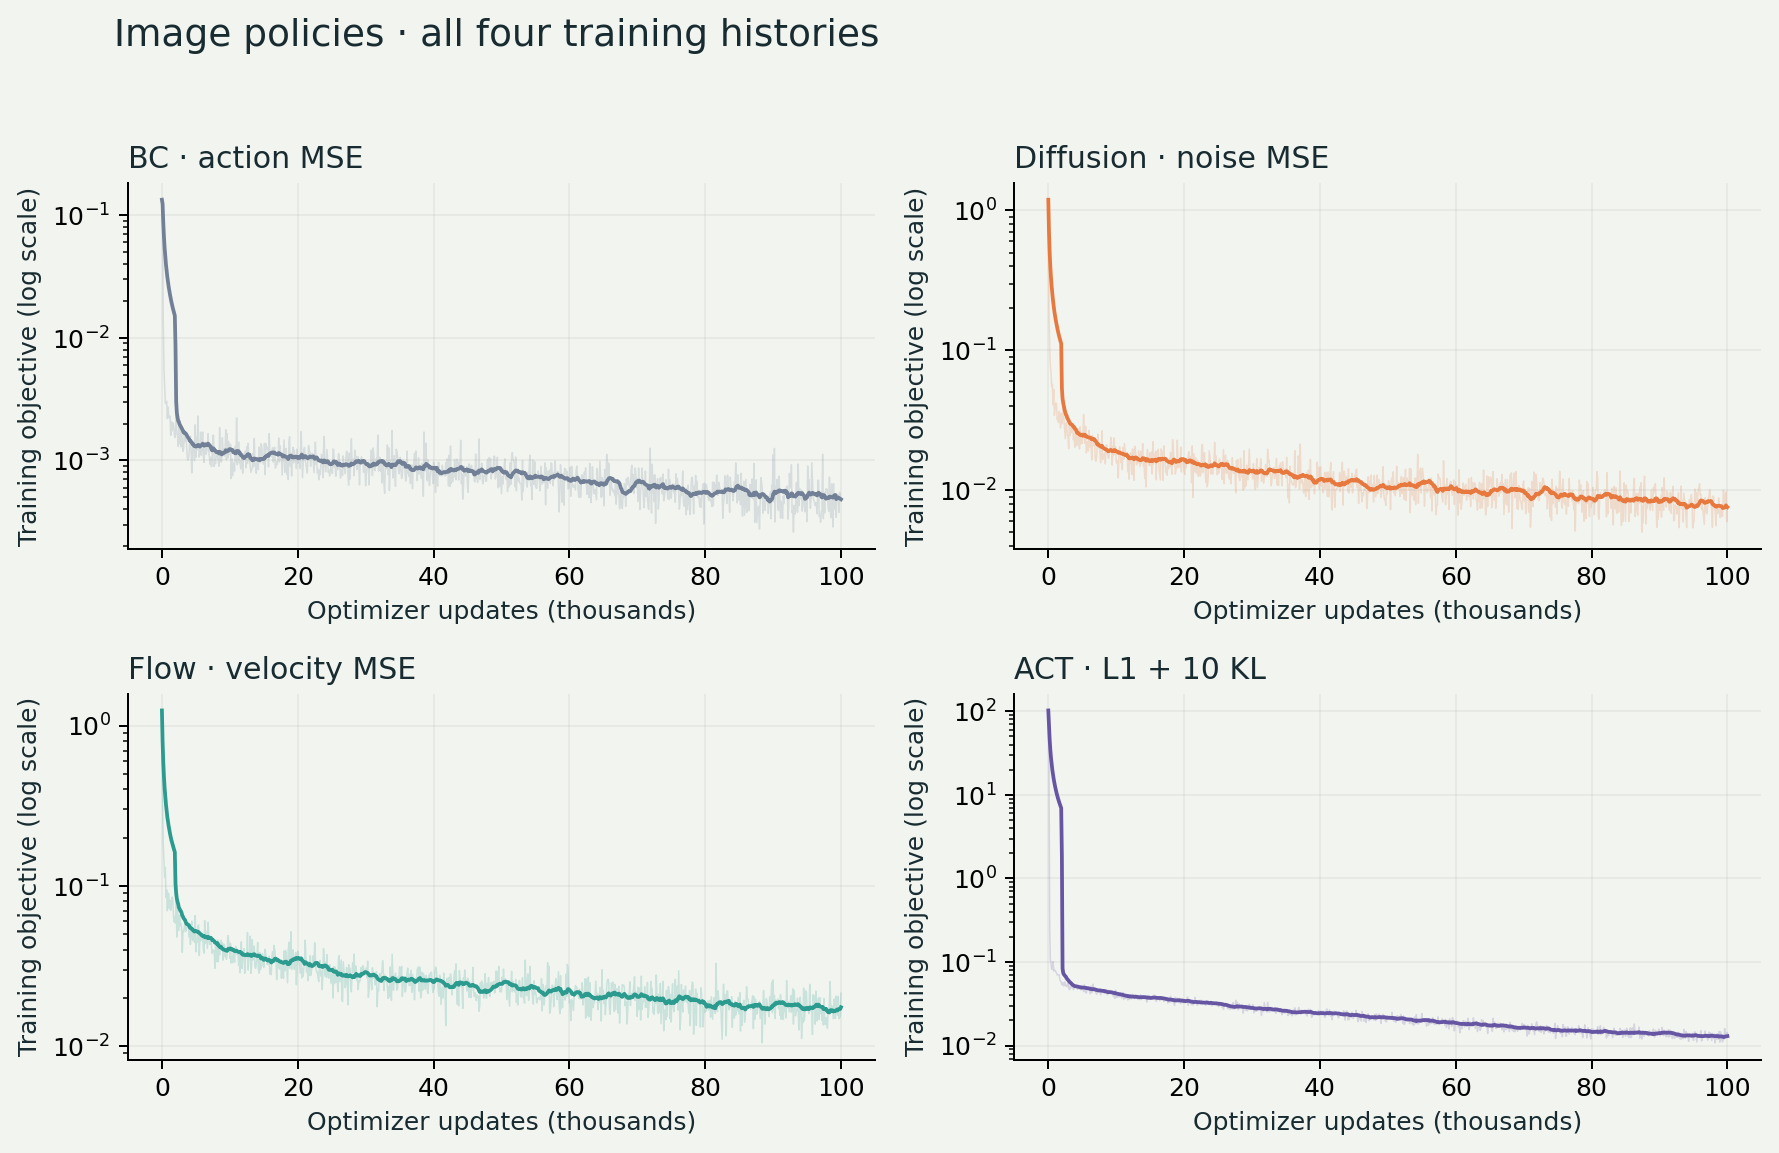
BC reaches low supervised error but solves zero state tasks and only five image tasks. A plausible explanation is the difficulty of choosing among contact strategies with a single-step deterministic regressor, followed by compounding errors during execution. The current comparison does not isolate that mechanism from architecture, horizon or optimization. The failed rollouts are a reason to keep closed-loop evaluation alongside loss.
Seen starts and unseen angles use smaller curves
The success curves use 52 fixed training starts and 52 fixed unseen-angle starts, one per letter. The training starts come from demonstrations; the test starts are a subset of the 520-task manifest. These are simulator rollouts from those states, not accuracy on recorded expert actions. A single success changes a curve point by 1.92 percentage points.
The test manifest was sampled with seed 20261027 before training. Curve-subset selection uses seed 20261028; policy sampling during evaluation resets the PyTorch RNG to 20261026. Its ten angles are at least 3° from the twelve demonstration angles and from one another. Test starts were not filtered for planner success. All algorithms and both observation types share the tasks. The curves monitor progress; the final EMA at the predetermined update budget remains the reported model.
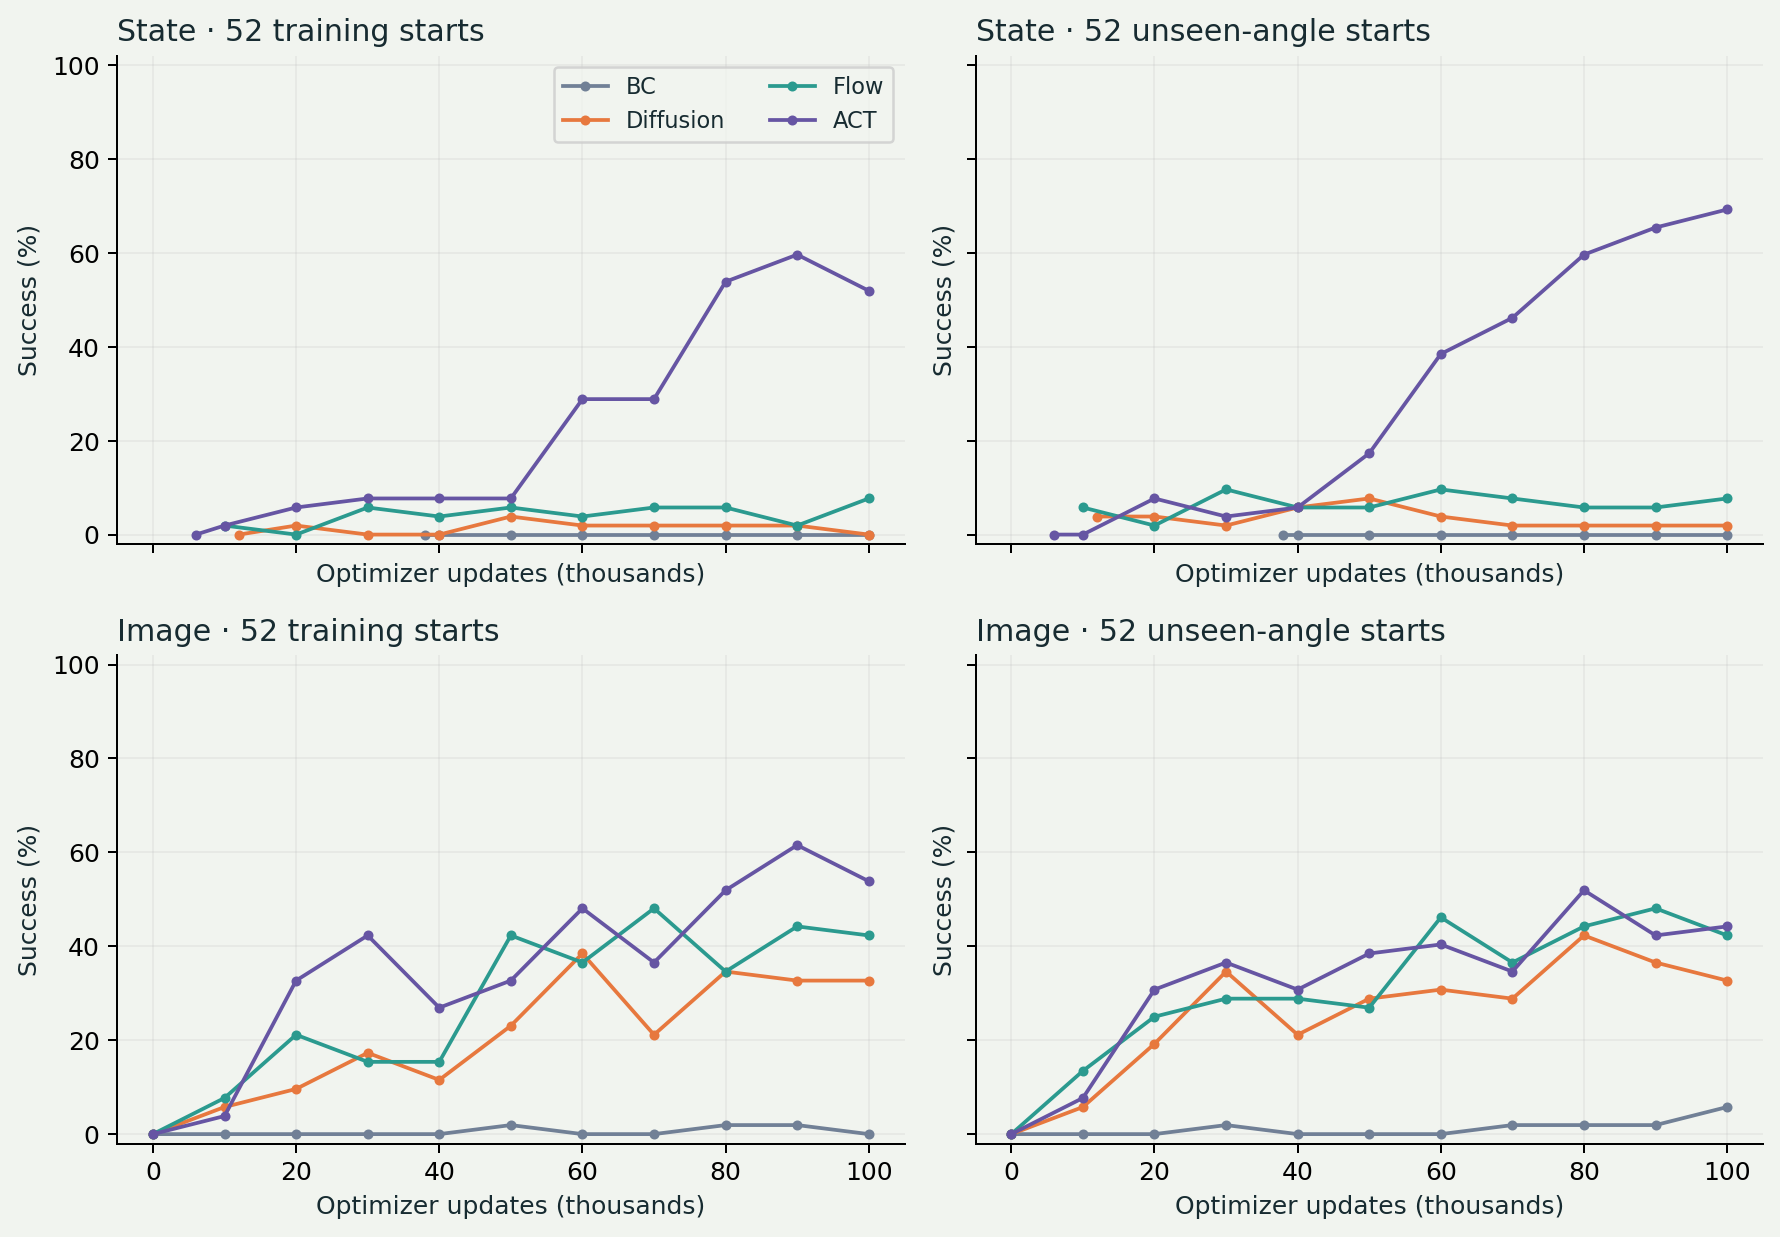
State success snapshots were added after training had begun. The first available checkpoints are BC 38k, Diffusion 12k, Flow 10k and ACT 6k; missing earlier success rates are left absent. The image curves include initialization and every 10k updates. Loss history exists earlier than the state success history.
At the final checkpoint, the 52-case curve counts are:
| Observation | Algorithm | Training starts / 52 | Unseen-angle starts / 52 |
|---|---|---|---|
| state | BC | 0/52 | 0/52 |
| state | Diffusion Policy | 0/52 | 1/52 |
| state | Flow Matching | 4/52 | 4/52 |
| state | ACT | 27/52 | 36/52 |
| image | BC | 0/52 | 3/52 |
| image | Diffusion Policy | 17/52 | 17/52 |
| image | Flow Matching | 22/52 | 22/52 |
| image | ACT | 28/52 | 23/52 |
For example, state ACT’s 36/52 test curve point is 69.23%, while its full final score is 319/520, or 61.35%. Both are correct for their respective sets. The 52-case number should not replace the final score. Raw loss CSV · Success-curve CSV · All final episode outcomes.
Failures that the aggregate still hides
The following state-ACT examples come from the same final evaluation. All six were independently replayed locally with zero recorded state discrepancy. They were selected to show success and failure for T, S and a; their balanced selection is not a success-rate estimate.
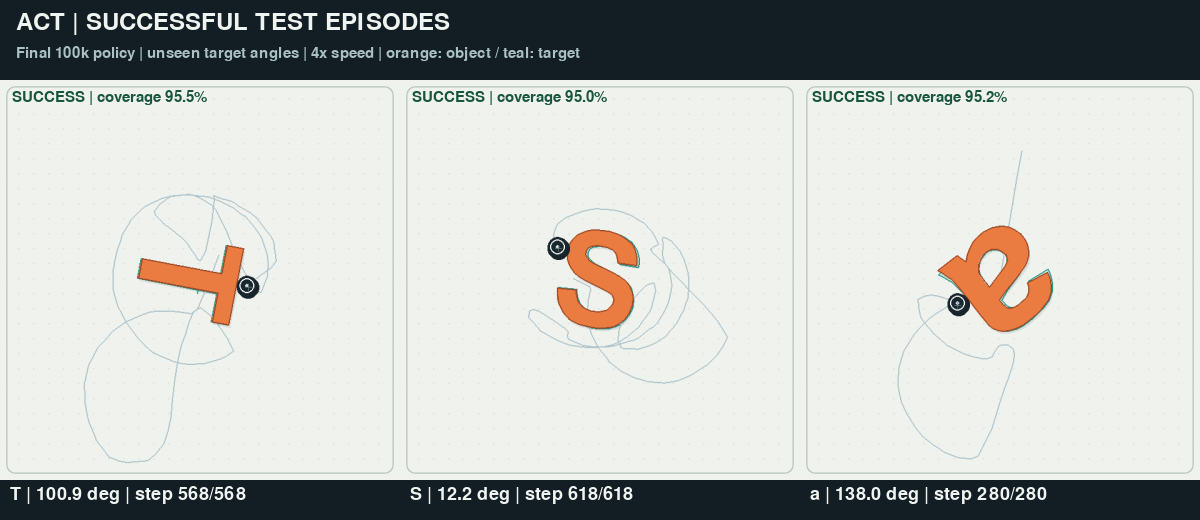
Successful T, S and a examples take 568, 618 and 280 steps respectively. Their final coverages are 95.45%, 95.02% and 95.19%.
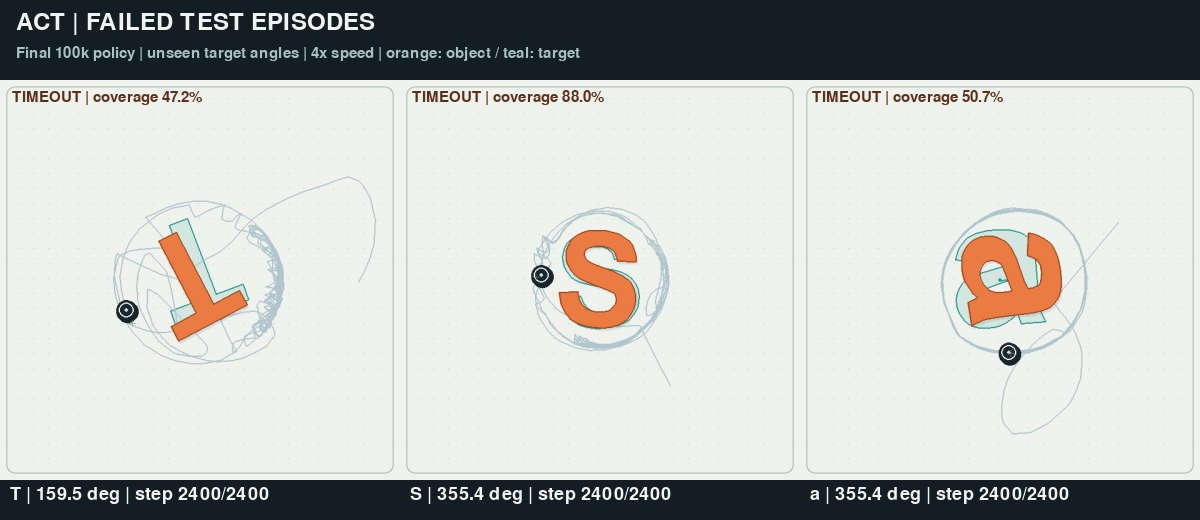
Each failure reaches the 2,400-step limit. T briefly reaches 87.89% coverage but ends at 47.24%; S reaches 90.55% and ends at 88.03%; a ends at 50.74%. The pale lines trace pusher history. Proximity and repeated contact can coexist with a persistent alignment error. The interactive project replays expose the motion and its history; the selection record gives exact task identities and replay checks.
The next data comparison
This report fixes the training condition at 10 demonstrations per letter–orientation pair. The published V2 dataset raises that to 100, or 62,400 episodes. The next policy comparison should retain a clearly identified data revision and the same evaluation tasks. Its purpose is to measure how much the ranking changes with data coverage. Results from that larger condition are not part of the tables above.
I would repeat the seeds and match action horizons before turning these numbers into a broad algorithm recommendation. The present tasks use known letters, one font and center targets. They do not measure transfer to new characters, fonts or arbitrary target locations. Successful-only demonstrations also leave failed recovery behavior underrepresented, and geometry symmetries complicate a literal interpretation of “unseen angle.”
Online reinforcement learning is a separate experiment: it generates interaction data during training, so demonstration release labels V1/V2/V3 do not define its training input. Reward, reset distribution, code and seed still need versions. The two PPO attempts so far did not establish a successful policy; they are not included in this imitation-learning ranking.
Citation / 引用
Environment, contact-sampling planning implementation and dataset by Lixin Xu (许立昕). Code: MIT. Demonstrations: CC BY 4.0. Third-party font rights are separate. Please cite both the software/method and dataset entries below, taken from the project’s CITATION.bib.
@software{xu2026pushanyletter,
  author = {Xu, Lixin},
  title = {Push Any Letter: A 2D Letter-Pushing Environment and Planning Baselines},
  year = {2026},
  version = {0.1.0},
  url = {https://github.com/DavidLXu/Push-Any-Letter}
}

@misc{xu2026pushanyletterdata,
  author = {Xu, Lixin},
  title = {Push Any Letter: Center-12 High-Friction Demonstrations},
  year = {2026},
  howpublished = {Hugging Face},
  note = {Version center12-friction14-v1, CC BY 4.0},
  url = {https://huggingface.co/datasets/DavidLXu/Push-Any-Letter}
}
Reproducibility assets / 复现材料:configuration, source hashes and results · final episode records · asset checksums · loss PDF: state / image · success-curve PDF.